

Key Takeaways
- A pricing table in Elementor is a row of plan cards, each with one price, a short feature list and a button; it is built to get a click on one plan.
- An Elementor comparison table is a grid with one row per feature and one column per plan or product; it is built to answer “which plan has X” before the click.
- The Master Addons Pricing Table widget makes one card per widget, with five layouts, a ribbon, a sale price and feature tooltips; the Comparison Table widget (Master Addons Pro) makes the whole matrix in one widget with up to six columns.
- Most pricing pages need both: cards at the top for the decision, a comparison table below for the detail, linked by a “Compare every feature” anchor.
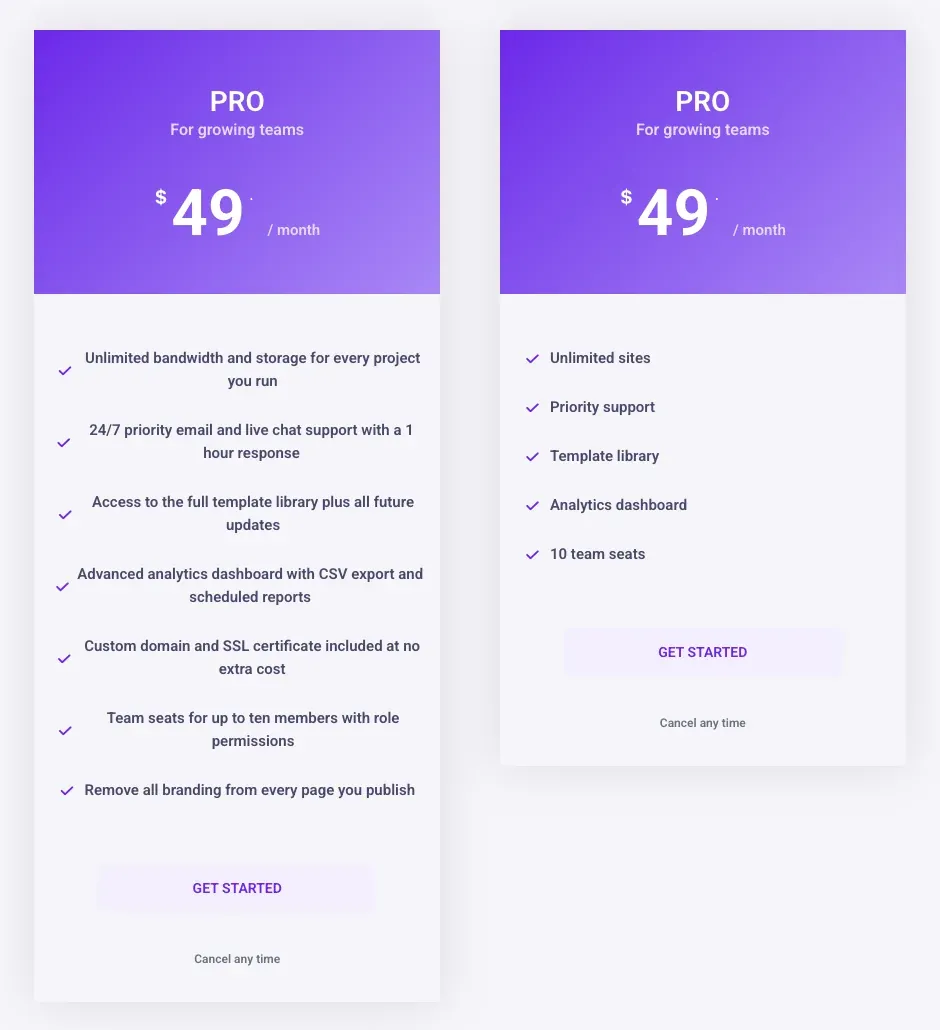
- A pricing card should hold three to seven feature rows; anything longer belongs in the comparison table, where a tooltip can explain a row without lengthening it.
- The Comparison Table widget switches to a stacked layout below a breakpoint you set, which keeps a six-column matrix readable on a phone.
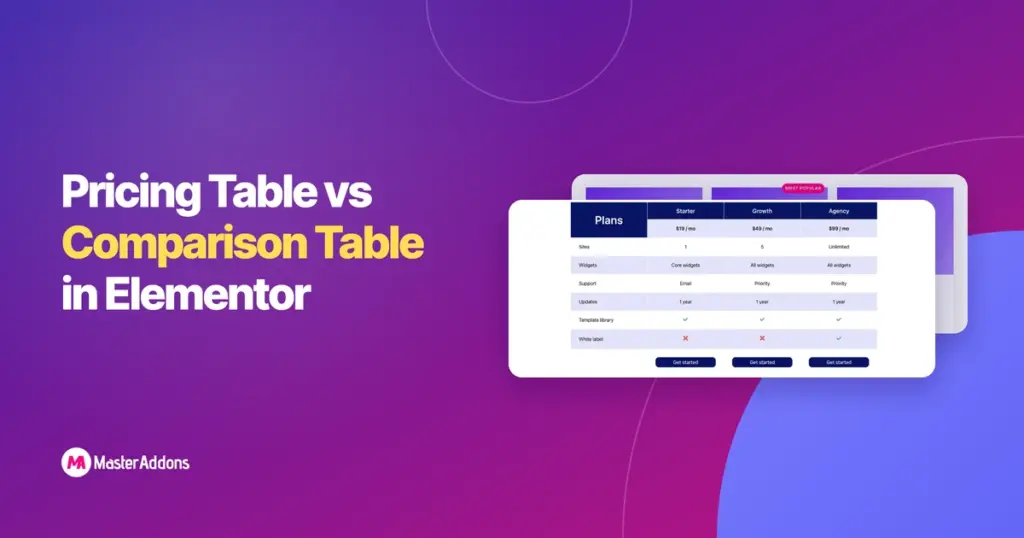
An Elementor comparison table and an Elementor pricing table look related and do different jobs. The pricing table is a row of cards that asks the visitor to pick a plan. The comparison table is a grid that lets the visitor check a feature across every plan before picking. Put the wrong one in front of the reader and they either cannot decide or cannot find the detail.
This post shows one example of each, built with Master Addons on the same three plans, and sets out when each one is enough, when you need both, and how they fit together on one page. The Pricing Table widget is in the Master Addons plugin; the Comparison Table widget is in Master Addons Pro.
Table of Contents
The difference in one sentence
A pricing table shows plans as cards and asks for a decision; a comparison table shows features as rows and supports the decision with detail. The pricing table is read top to bottom inside one card. The comparison table is read left to right across one row. That reading direction is the whole difference, and it decides what each one can hold.
What a pricing table does
A pricing table puts each plan in its own card: name, who it is for, price and period, a short feature list, and one button. One card is raised with a ribbon so the reader has a default. The reader compares cards by glancing across the row, which only works while each card stays short.
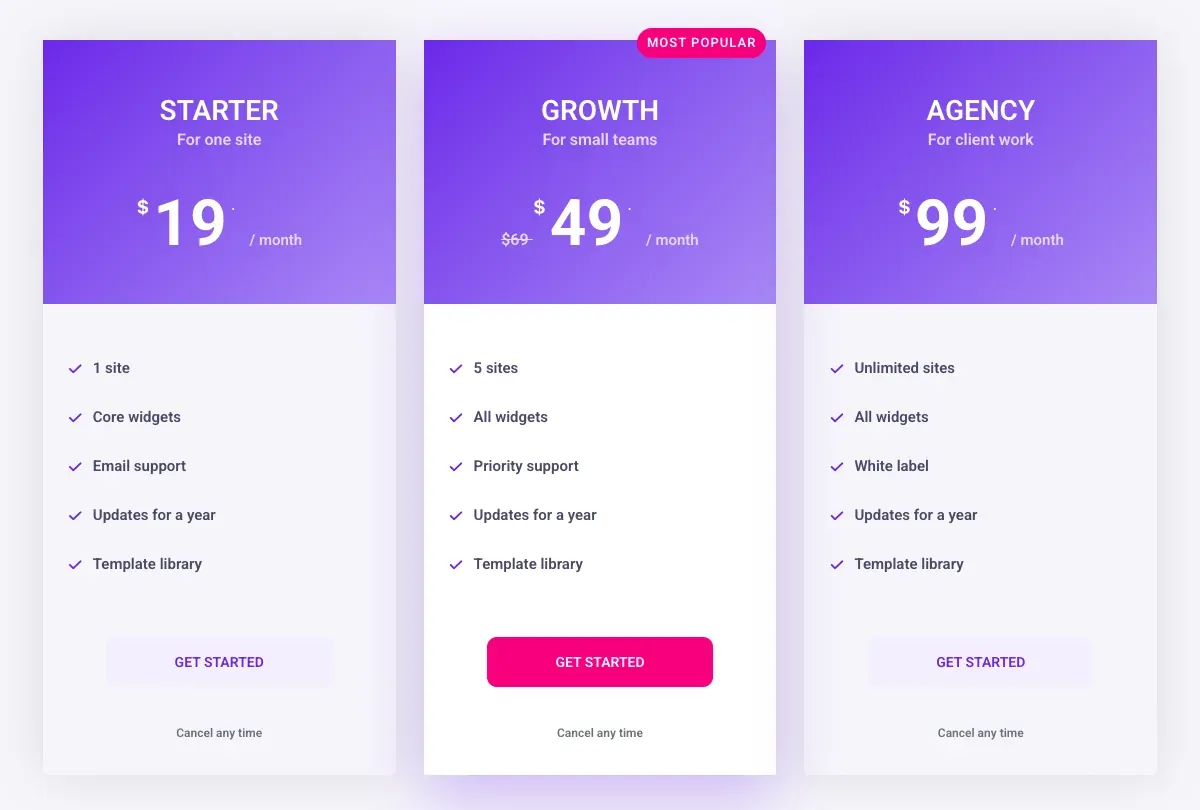
The limit is the feature list. Five rows per card reads in a few seconds. Fifteen rows per card means the reader scrolls inside the row and loses the comparison. If you find yourself writing “and much more” at the bottom of a card, the card has hit its limit and the rest belongs in a comparison table.
What a comparison table does
A comparison table lists every feature once, down the first column, and marks each plan’s value across the row: a number, a word, or a tick and cross. The header row carries the plan names and prices, and a button row at the bottom links each column to checkout. The reader finds the one feature they care about and reads across.
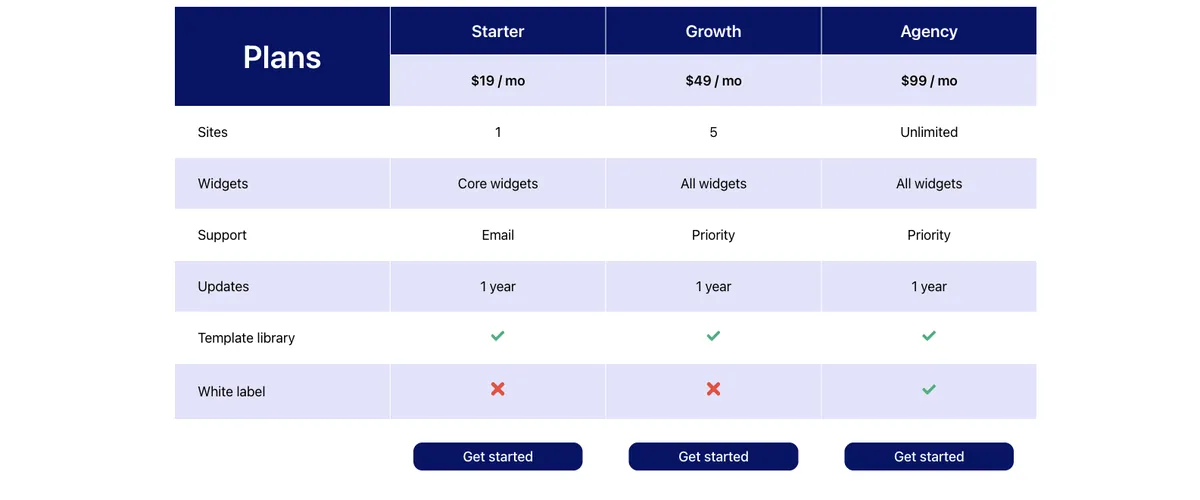
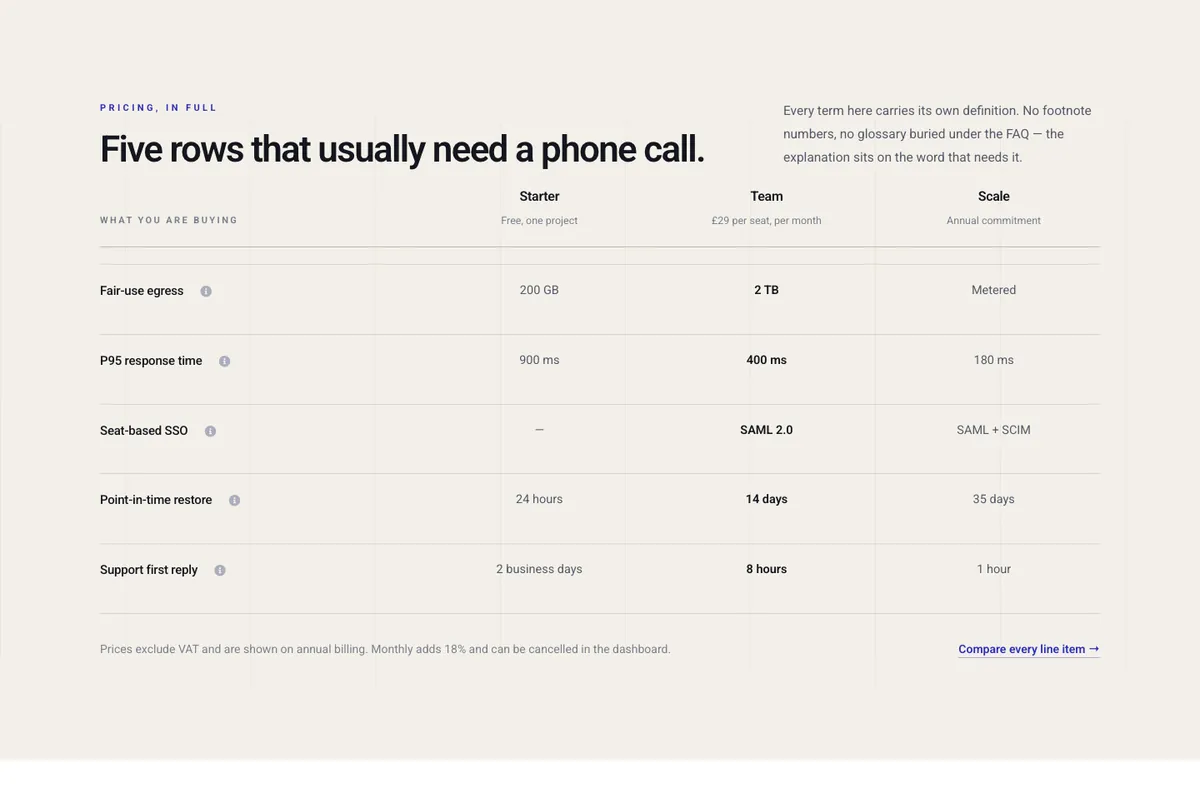
Because every feature is a row, the table can hold twenty or thirty features without getting wider. It gets longer, which scrolls fine. A tooltip on a feature name keeps the row short while explaining what the feature means, which is why plan comparison tables on SaaS pricing pages carry small info icons next to the labels.
Pricing table vs comparison table side by side
| Factor | Pricing table | Comparison table |
|---|---|---|
| Shape | One card per plan, in a row | One row per feature, one column per plan |
| Reading direction | Down one card | Across one row |
| Features it can hold | Three to seven per card | Dozens |
| Job | Get a click on one plan | Answer “does plan X have feature Y” |
| Highlighted plan | Raised card, ribbon, solid button | Highlighted column |
| Price | Large, on each card | In the header row |
| Place on the page | Top, under the heading | Below the cards, or on its own page |
| Master Addons widget | Pricing Table, one widget per card | Comparison Table (Pro), one widget for the matrix |
| Mobile | Cards stack in one column | Stacks below a breakpoint you set |
When a pricing table is enough
A pricing table alone is enough when the plans differ by a handful of limits and the reader can decide on price. Three plans with “1 site, 5 sites, unlimited sites” and five rows each do not need a matrix. A single plan on a landing page is one card. A membership site with two tiers is two cards. If every feature fits on the cards without wrapping and nobody asks “does the Starter plan include X” in support, stop there.
The pricing table design tips cover how to keep the cards short: three to six words per row, the same rows in the same order on every card, and a tooltip for the two rows that get questions. For ready-made cards, the pricing table templates post has five layouts and seven sections with their settings.
When you need a comparison table
You need a comparison table when the plans differ by many features, when the features need explaining, or when the reader is comparing your product with someone else’s. The table also carries the tick and cross answers that cards handle badly: a card with grey crossed-out features looks like a list of things you cannot have, while a row of ticks and crosses looks like information.
A comparison table also works on its own for product comparisons that are not about plans at all, such as three models of one product or your plugin against two rivals. The Comparison Table widget takes an image per column for that, with a title, a price and a button.
How to use both on one page
Most SaaS pricing pages run both. The cards sit at the top under the heading and the billing switch; the comparison table sits lower on the page under a heading like “Compare every feature”, with an anchor link from under the cards. The cards make the sale for the reader who already knows what they want. The table catches the reader who scrolled past the cards because one row was missing.
Keep the plan names, order and prices identical in both. If the cards say Starter, Growth, Agency from left to right, the table columns say the same. Highlight the same plan in both: a raised card above, a tinted column below. And give the table its own button row so the reader who decided in the table does not scroll back up to click.
Building each one in Elementor
The pricing table
Add a container, give it three child containers, and drop a Pricing Table widget into each. Set the layout from the five in the dropdown, then the plan name, subtitle, price, period and features in the Content tab. Turn on Highlight Table and the ribbon for the middle card. Set the parent container’s Align Items to Stretch so the cards match heights.
The comparison table
Drop one Comparison Table widget onto the page. Pick a skin from the four, set the number of products (up to six), and add the feature names to the Features list. Then open each product column: title, price, button text and link, and one entry per feature where the type is Yes, No, an icon or text. The style tab has a responsive breakpoint setting that decides where the table stacks on small screens.
Both widgets edit in the Elementor panel, so the plan names and prices are text that search engines read and that you can change without touching an image.
Want both from one plugin? The Pricing Table widget builds the cards, and the Comparison Table widget in Master Addons Pro builds the matrix under them.
Frequently asked questions
Does Elementor have a comparison table widget?
No. Elementor and Elementor Pro have no comparison table widget. The Table of Contents, Price Table and Price List widgets in Pro do other jobs. A feature matrix comes from an addon; the Master Addons Comparison Table widget is in Master Addons Pro.
Can a pricing table show a feature comparison?
Only a short one. Each card holds its own feature list, so a comparison across plans means reading three lists side by side. Up to about seven rows that works. Past that, put the full list in a comparison table and keep the cards to the rows that differ.
What is the difference between a pricing table and a pricing comparison table?
A pricing table is a row of plan cards with one price each. A pricing comparison table is a feature matrix with plans as columns, usually with prices in the header. The first sells a plan; the second lets the reader check features before choosing.
How many columns can a comparison table have?
The Master Addons Comparison Table widget takes up to six product columns plus the feature column. On a phone it stacks below the breakpoint you set in the widget, so each plan becomes its own block.
Should the comparison table be on the pricing page or its own page?
On the pricing page, below the cards, for most sites. A separate page splits the decision from the detail and loses readers between the two. Move it to its own page only when the matrix runs to dozens of rows.
Final thoughts
Cards with three to seven rows and one highlighted plan get the click. A matrix with one row per feature answers the questions that stop the click. On most pricing pages the cards go at the top and the matrix goes below, with the same plan names, order and highlight in both.
Build the cards with the Pricing Table widget and the matrix with the Comparison Table widget, and link them with one anchor.
Related reading
